

What if real numbers about our warming planet could point us to a brighter future? Clear figures show rising temperatures and fast-melting ice. These numbers prove our world is changing and that smart actions today really matter. This post uses solid evidence to explain our warming climate and offers hope with practical, sustainable solutions.
Essential Climate Change Facts Overview

We have collected proven facts that show how fast our planet is warming. They help us see the real impact of climate change.
- Global temperatures have increased by more than 1°C since the start of the Industrial Revolution.
- The last decade was the hottest in 125,000 years.
- Between 1971 and 2010, the oceans took in about 90% of extra heat. In 2020, they absorbed 20 sextillion joules of energy.
- Levels of carbon dioxide (a key greenhouse gas) rose from about 280 parts per million before industry to nearly 420 parts today.
- Every year, about 1.2 trillion tons of ice melt change coastlines and impact polar areas.
- In 2019, extreme heat led to a loss of 302.4 billion work hours worldwide.
- Wildlife numbers have dropped by 69% in the past 40 years, putting almost one million species at risk.
- Since 2008, more than 376 million people have had to leave their homes because of climate disasters.
- Global plastic production has doubled in the last 20 years, yet only 9% is recycled, which worsens pollution.
- If high-emission trends continue, climate change could cut global GDP by up to 18%.
These facts give a clear picture of a planet under stress. They remind us that our air, oceans, and wildlife are changing fast and that we need strong, global moves toward sustainable solutions.
Scientific Evidence and Temperature Trends in Climate Change
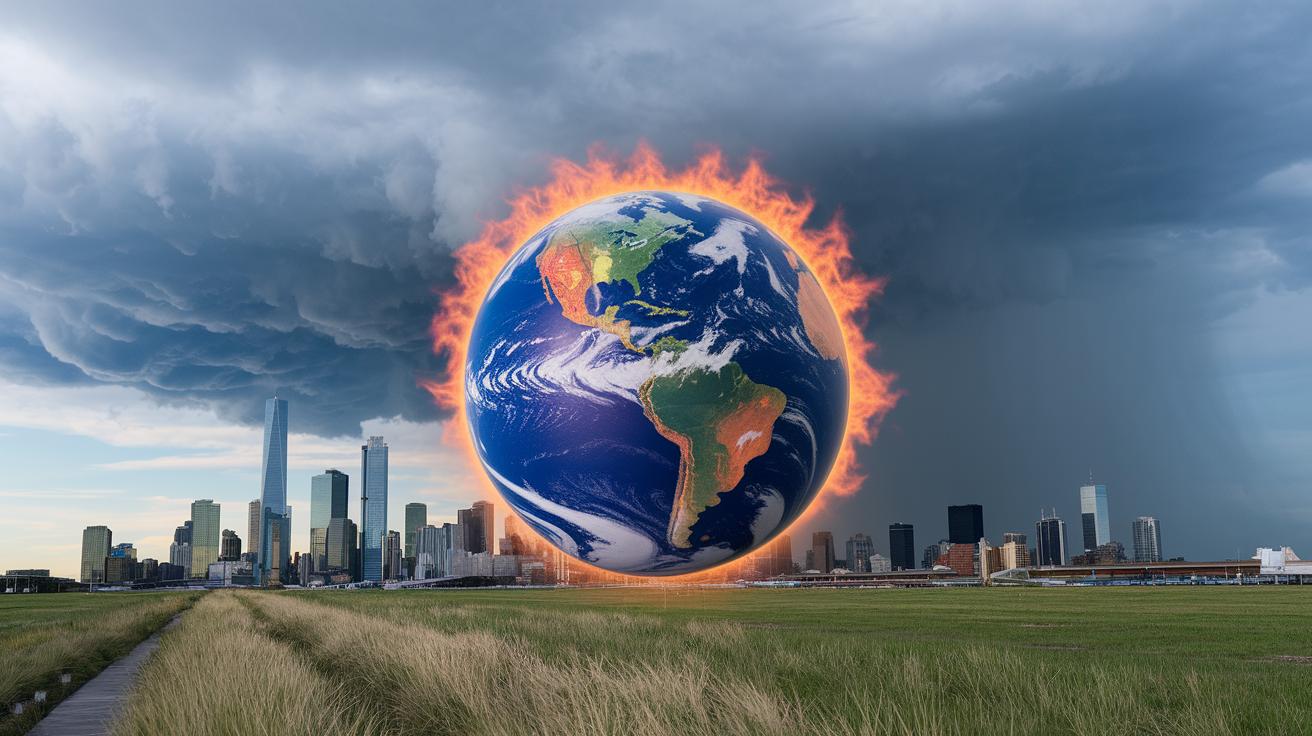
Climate records show that our planet has been warming slowly for over a century. From 1850 to 1980, global temperatures went up by an average of 0.07°C per decade. Even these small changes add up over time and have paved the way for today's climate problems.
Since 1981 the warming has sped up to 0.2°C per decade. The past decade has been the warmest in 125,000 years, highlighting how today's weather patterns are very different from natural cycles of the past. This faster warming allows the air to hold more moisture, which can lead to heavier rain, worse droughts, and stronger heat waves.
| Period | Rate (°C/decade) |
|---|---|
| 1850–1980 | 0.07 |
| 1981–Present | 0.2 |
These trends point clearly to human actions as a main driver of climate change. When temperatures rise, the air holds more moisture, causing weather to become more extreme. The robust scientific data tells us that urgent steps based on reliable research are needed.
Atmospheric CO2 Measurements and Global Emissions Data
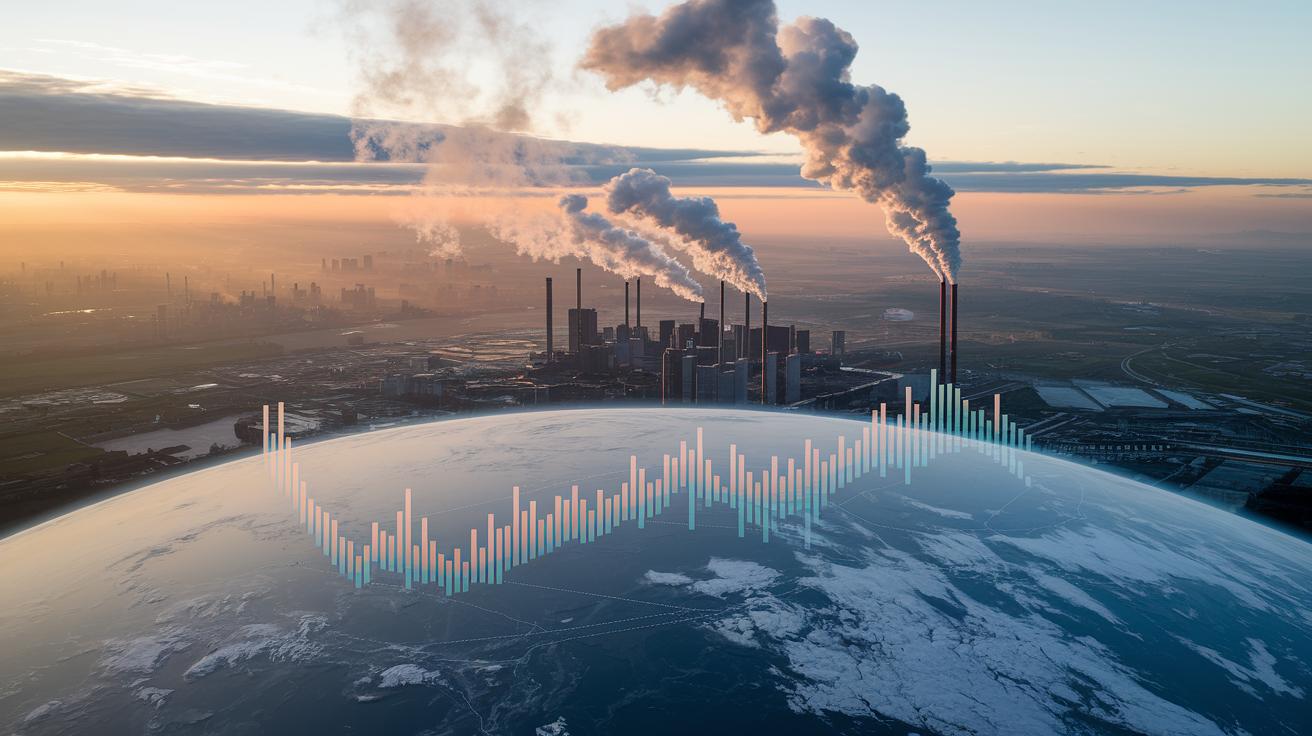
Atmospheric carbon dioxide has risen quickly since before the industrial age. Levels went from about 280 ppm (parts per million) to nearly 420 ppm today. This jump is mainly due to burning fossil fuels, industrial work, and cutting down forests. More CO2 in the air traps additional heat, changing our climate and boosting the greenhouse effect.
- CO2 levels increased from roughly 280 ppm before industry to almost 420 ppm now.
- China adds about 26% of the world's CO2, showing its major role in today's emissions.
- The United States contributes about 13% of global emissions and has the highest total emissions in the last 150 years.
These high levels of emissions trap extra heat in our atmosphere. That extra heat leads to higher temperatures and unpredictable weather around the world. The warming not only breaks temperature records; it also changes ecosystems and weather patterns. Experts agree that lowering emissions is key to slowing down warming and reducing the impact of climate change on people and nature.
Effects of Rising Temperatures and Extreme Weather in Climate Change

Global temperatures are rising and changing the way weather behaves around the world. Warmer air holds more moisture, which leads to heavier downpours and shifts in weather patterns. Some regions now suffer from longer drought periods, while others face sudden, intense rain. These changes put pressure on nature, local communities, and economies.
- Heavier rain events
- Longer droughts
- More frequent heat waves and lost work hours
- Worsened respiratory problems
- Greater spread of disease carriers
Extreme heat disrupts daily life and carries a heavy cost for society. In 2019, heat-related stress led to 302.4 billion lost work hours, cutting into productivity and threatening economic stability. Warmer conditions increase pollen levels, worsening allergies and asthma. At the same time, ticks and mosquitoes expand into new areas, raising the risk of illnesses they spread. These factors strain healthcare services and lower the quality of life. Many regions also face crop failures and water shortages as extreme weather events become more common.
This mix of environmental and human challenges shows how urgent it is to adopt measures that protect our livelihoods and public health amid a rapidly shifting climate.
Ocean Heat Uptake, Ice Loss, and Sea Level Rise Data

Oceans take in most of the extra heat produced by human activity. Studies show that this heat absorption helps control air temperatures but also makes the water expand. This expansion now adds about 0.7 mm each year to global sea levels, boosting flood risks in low-lying regions.
| Metric | Value |
|---|---|
| 1971–2010 Heat Uptake | 90% |
| 2020 Ocean Heat | 20 sextillion joules |
| Annual Ice Loss | 1.2 trillion tons |
Warmer waters reduce the strength of ice, which changes local sea levels and how sand and soil move along coasts. Regions like parts of Southeast Asia and the Arctic now see more erosion, stresses on buildings, and shifts in marine habitats because of faster melting. For example, some Pacific islands have lost up to 15 meters of shoreline over the past decade due to rising seas.
Historical Temperature Records and Climate Change Timeline
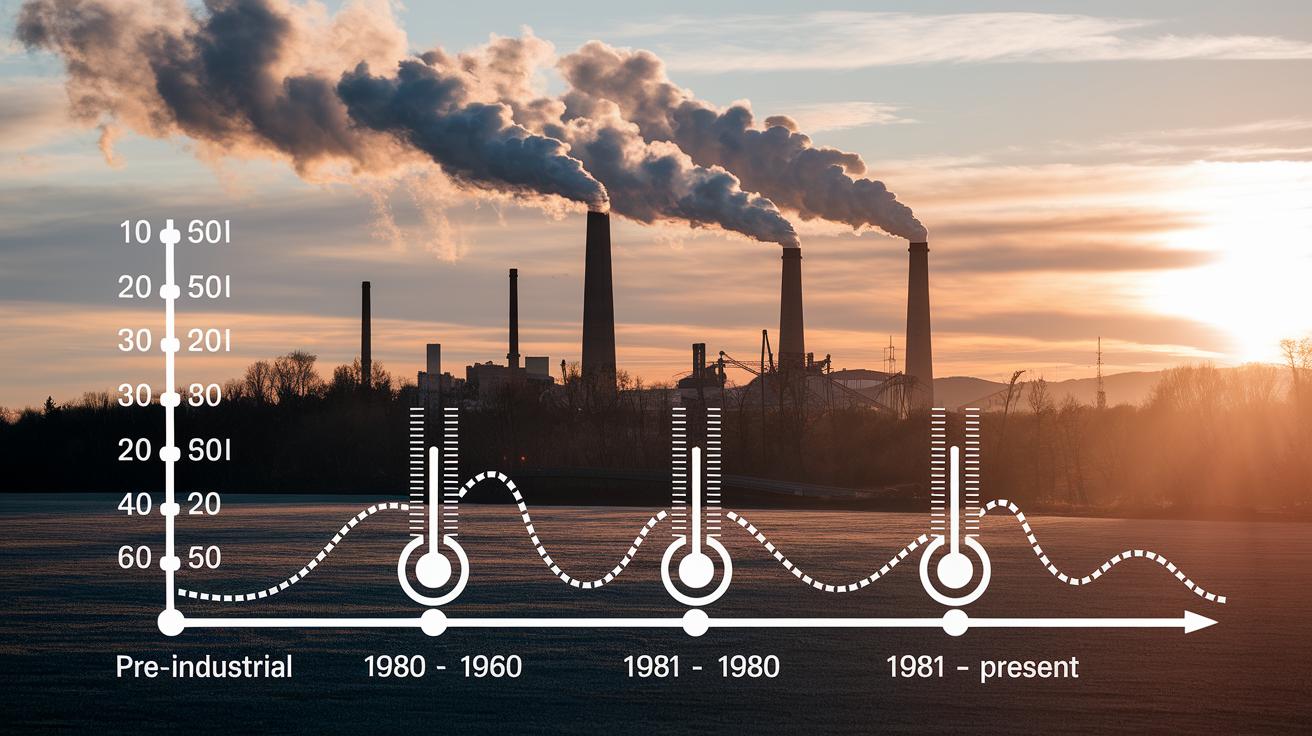
Looking at Earth's temperature records shows how industry has changed warming speeds over time.
| Era | Trend |
|---|---|
| Pre-Industrial to 1980 | +0.07°C/decade |
| 1981 to Present | +0.2°C/decade |
- The start of the Industrial Revolution
- A warming boost in the mid-20th century
- A record-breaking decade recently
This timeline highlights key moments in Earth's warming history. The Industrial Revolution marked when people began to change the climate. Since 1980, the planet has warmed much faster, and the last decade was the hottest in 125,000 years compared to past ice ages.
Future Temperature Projections and Warming Trend Predictions
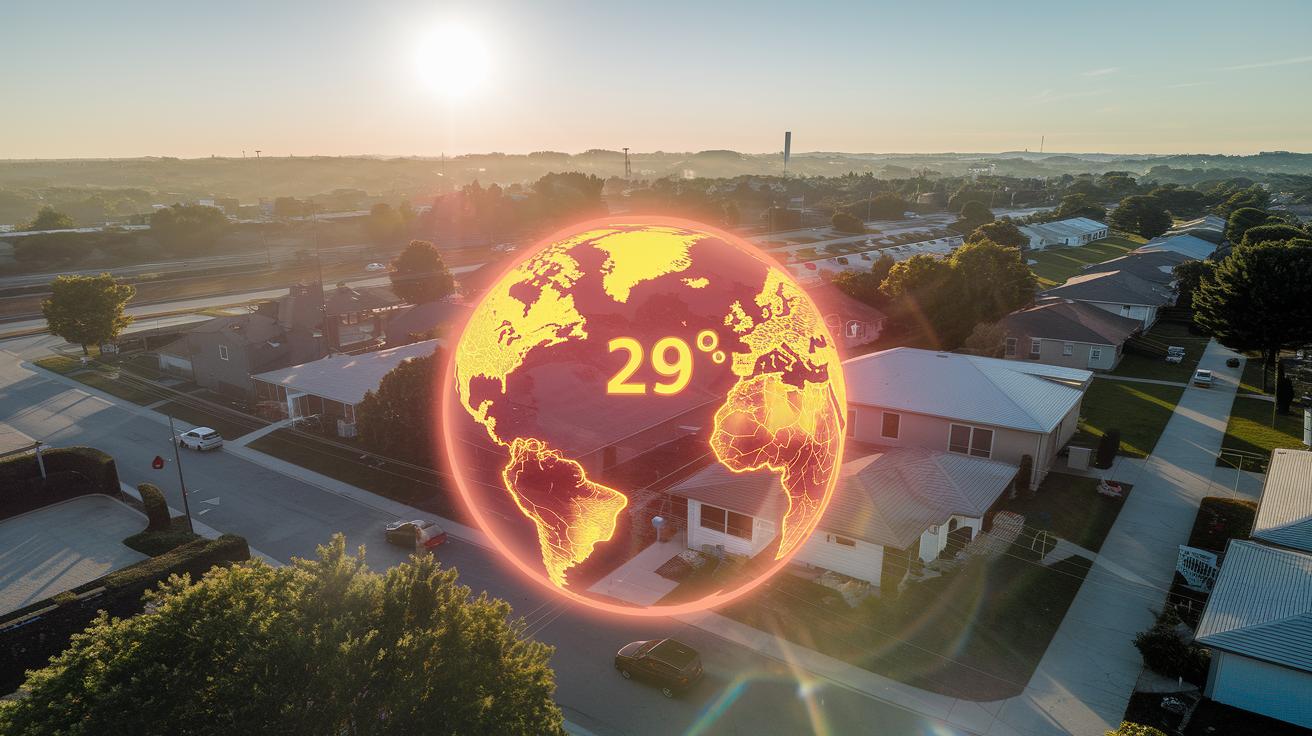
Right now, only 0.8% of Earth's land has an average temperature above 29°C. In many places, this number marks the line between climates that people can handle and climates that could hurt farming, health, and everyday living. Forecasts show that by the end of the century, many more regions could pass this temperature line. This change may put serious stress on local jobs and communities.
- The area of land over 29°C, now at 0.8%, could grow a lot.
- We will see more days of extreme heat, which may limit outdoor work and play.
- More regions might get too hot, making them hard places to live.
- Rising heat could lead to more lost work hours because it lowers productivity.
These forecasts come from detailed temperature models, showing that we need to act quickly. But there is some uncertainty because natural weather changes and shifts in energy and land use can alter the outcomes. As higher temperatures continue to strain both nature and human systems, planners and community leaders must use these findings when preparing for emergencies, planning cities, and making economic decisions. Better models and more research are needed to sharpen these forecasts. For now, investing in ways to adapt and build resilience is our best hope to face a hotter future while keeping communities strong.
Economic and Human Impact Facts of Climate Change

Economic forecasts show that GDP loss is not the same everywhere. Regions hit hard by extreme weather face losses that go beyond the global average. Coastal areas that depend on tourism and fishing are now putting new financial measures in place to handle future losses. Leaders in these regions are speeding up investments in renewable energy and upgrades to infrastructure to lessen economic damage. For example, in one small island nation, early adaptation efforts helped cut the projected GDP loss to nearly 4% even as climate threats grew.
Climate change also affects work hours and forces many to leave their homes, and its impact is not the same across communities. Areas with little ability to adapt suffer more. Both cities and rural spots see changes in work patterns because strong heat cuts productivity and pushes people to move. Local governments are testing early-warning systems and help programs to support displaced families and affected workers. Studies in South Asian cities suggest that focused support measures can help keep local economies stable under climate stress.
| Impact | Value |
|---|---|
| Mid-century GDP Loss | 11–14% |
| High-emissions GDP Loss | 18% |
| Work Hours Lost (2019) | 302.4 billion |
| Displaced People (since 2008) | 376 million |
Mitigation Strategies and Renewable Energy Impact on Climate Change

Fighting climate change means both strong government rules and everyday changes by people. Governments need to set clear rules to lower fossil fuel use, while individuals can change small habits every day. Both types of action help cut carbon emissions and move us toward clean energy.
- Set a carbon price to phase out fossil fuels.
- Expand solar and wind energy.
- Plant more trees and change land use.
- Boost energy efficiency in industries and buildings.
- Invest in research for low-carbon technologies.
These steps offer a clear plan to lower greenhouse gases and create a cleaner future. Investing in renewable energy not only reduces reliance on fossil fuels but also creates jobs and sparks new technology. This helps lower energy costs, increase energy security, and improve air quality. Together, smart policies and personal actions build a healthier, more stable world.
Final Words
In the action, the article presented ten key climate change facts and detailed warming trends, rising CO₂ levels, extreme weather, ocean heat uptake, historic records, future projections, economic impacts, and actionable mitigation strategies. The discussion broke down critical data from verified warming data to global economic shifts and provided clear, numbered lists and tables for clarity. These climate change facts offer a solid foundation for understanding risks and prompt smart planning for a safer, more resilient future.
FAQ
What are some interesting climate change facts for students?
The interesting climate change facts include rising global temperatures by over 1°C since the Industrial Revolution, increased CO₂ levels from 280 to 420 ppm, major ice loss, lost work hours, and declining wildlife populations.
What are five key facts about climate change?
The five key facts are that global temperatures have risen over 1°C, the past decade is the warmest in 125,000 years, CO₂ levels jumped from 280 to 420 ppm, oceans absorbed excess heat, and wildlife numbers have dropped sharply.
What are the ten major effects of climate change?
The ten major effects include heavier rainfall, intensified droughts, more frequent heat waves that cut work hours, rising sea levels, challenges for agriculture, lower air quality, disrupted ecosystems, increased disease spread, economic strains, and habitat loss.
How can we solve climate change?
We can solve climate change by adopting strong policies, reducing fossil fuel use with wind and solar power, promoting reforestation, boosting energy efficiency, and investing in low-carbon technology research.
What do climate change facts and statistics reveal?
Climate change facts and statistics reveal steady temperature increases, sharp CO₂ surges, massive ocean heat uptake, large-scale ice loss, and broad impacts on human health, productivity, ecosystems, and economies.