
Small changes in temperature can shape our future. Climate data shows that even a small rise tells a story of warming land, seas, and a growing CO2 (carbon dioxide) footprint. In 2024, readings noted a 0.08 °C increase from last year's highs. These numbers come from over 22 million records collected since 1850. They show that our planet is changing before our eyes. This clear trend calls for better policies and faster moves toward clean energy to secure a brighter tomorrow.
Comprehensive Climate Change Statistics Snapshot
Metrics like temperature changes and CO₂ emissions show how our planet is shifting. They act as clear signals for scientists, leaders, and everyday people to understand how fast the planet warms. By measuring changes from before the industrial age, we see that more greenhouse gases and human actions have slowly increased temperatures over time.
| Metric | 2024 Figure |
|---|---|
| Global Mean Temperature Anomaly | +1.62 ± 0.06 °C |
| Land Surface Anomaly | +2.28 °C |
| Sea Surface Anomaly | +1.15 °C |
| CO₂ Emissions Trend (50-year increase) | Steadily rising |
In 2024, records showed an extra increase of 0.08 °C over 2023's high. Land areas warmed by +2.28 °C and oceans by +1.15 °C, meaning every region is affected even if some heat up faster than others. Meanwhile, emissions from fossil fuels and industry have kept going up for the past 50 years. This means current efforts are not enough to reach net-zero emissions. The numbers make it clear that stronger policies and a faster move to renewable energy are needed now.
Historical Warming Statistics and Temperature Trend Analysis

Since 1850, scientists have gathered more than 22 million monthly temperature records from 50,746 weather stations worldwide. They use the period from 1850 to 1900 as a starting point so we can see how temperatures have changed since before industrial times. This large and steady set of data helps researchers follow the Earth's temperature changes over many years. Imagine sorting through millions of data points to build a clear picture of global warming. This rich collection of records forms the base for studying long-term temperature trends.
In 2024, every month was at least 1.5 °C warmer than the pre-industrial average. At the beginning of the year, six months in a row set new record highs. A major warming was seen in the Northern Hemisphere’s Atlantic region during 2023 and 2024, similar to levels last seen in 1877 and 1878. Methods from NASA GISTEMP, NOAA’s GlobalTemp, and HadCRUT all agree on these results. This agreement among top research groups shows that the long-term warming trends are real and serious.
climate change statistics: Clear Data, Bright Future
Breaking down emission sources is essential for building useful climate statistics. Detailed data on CO₂ and other greenhouse gases helps guide policies and supports the shift to cleaner energy. Experts sort emissions by source so they can pinpoint areas that need new rules and fresh technologies.
- Annual growth rate of CO₂ and a 50-year total rise
- Shares by sector: energy, transport, and food production
- Differences in emissions per person
- Accounting methods based on consumption versus production
- Trend data on methane and nitrous oxide
- How policies affect current measures and net-zero plans
Progress toward net-zero has slowed as overall emissions keep growing. To meet net-zero goals, we need to lower human-made CO₂ and boost natural carbon sinks like forests and oceans. Research shows that while some policies have cut emissions in specific areas, the global total still rises, not counting land use changes. When we count hidden trade emissions, the gap between today’s actions and net-zero targets becomes even clearer. This raises real concerns about whether our current policies can match the climate challenge.
Some regions have reduced per-person emissions, which is promising, but challenges remain. For example, certain nations have lowered individual CO₂ outputs with cleaner energy and strict rules. Yet, a closer look by fuel type and sector reveals major differences that complicate a one-size-fits-all global solution. As policy makers work to expand renewable energy and enforce consistent rules, the data reminds us that local successes must be part of a bigger, coordinated effort to effectively fight climate change.
Sea Level Rise Statistics and Polar Ice Data
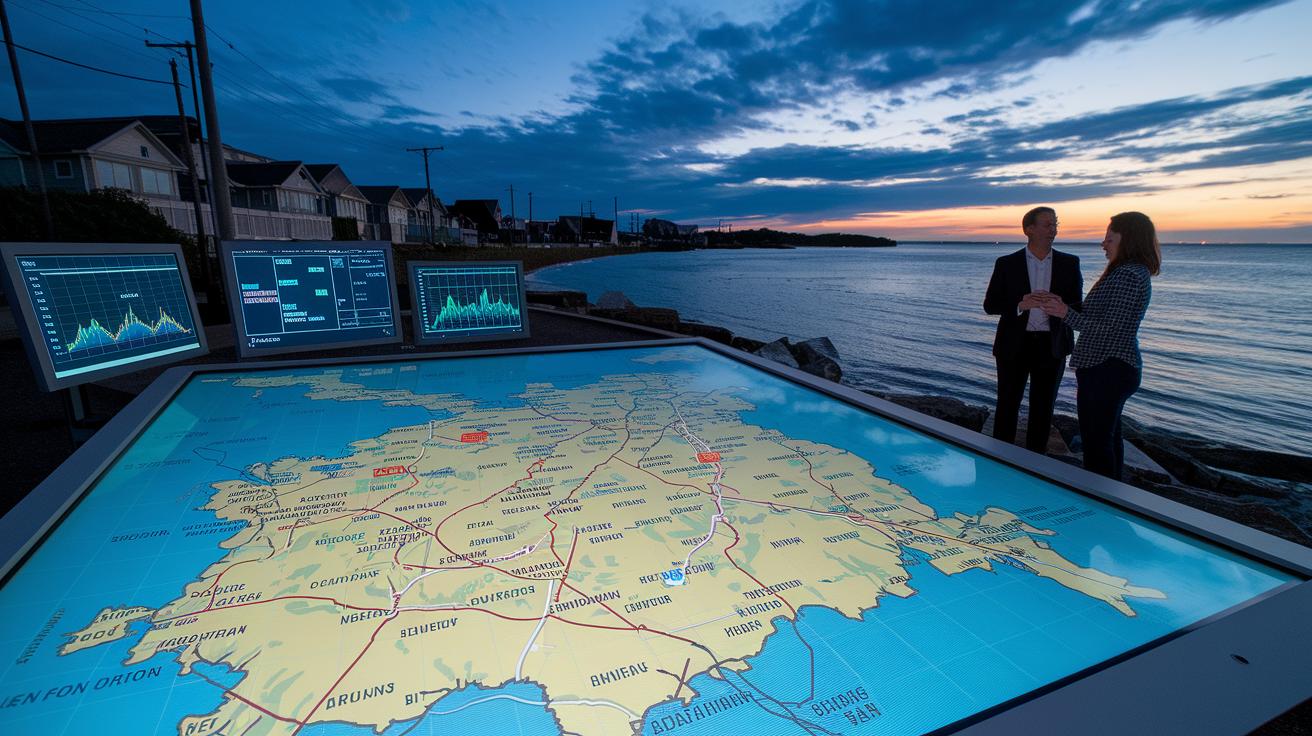
Global sea levels are rising, and this change points clearly to climate change. Interactive coastal maps show how water levels are shifting in local areas, even down to county lines. These tools help communities understand flood risks and changing property lines that can affect local taxes. The Picturing Our Future tool even forecasts sea level changes over centuries. Some areas are seeing faster rises than the world average, which means planners must adjust infrastructure and urban plans quickly.
Data on polar ice make the situation even more serious. Studies show that both Greenland and Antarctica are losing ice at a faster pace than before. Observations highlight that ice sheets are melting at a faster rate compared to past decades, and glaciers are steadily retreating. These melting glaciers add to sea level rise. The rapid loss of ice calls for science-based policies and adaptive strategies to help communities that are most at risk.
Regional Temperature Statistics and Extreme Weather Insights
In 2024, temperature records show unusual heat on land and sea. A map of temperatures highlights warming in Asia, Africa, North America, South America, the Atlantic, the North Pacific, and the Southern Ocean. Many countries report spots where temperatures are above long-term averages. This shows that both coastal and inland areas are much warmer than past records.
Recent storm data also point to stronger extreme weather. Studies reveal that hurricanes in the Atlantic grew stronger from 2019 to 2023, and each storm in 2024 shows clear signs of climate change. Research in 65 U.S. cities (covering 15% of the population) finds that urban areas are getting hotter, fueling more frequent heatwaves. These trends highlight shifts in storm behavior and longer periods of extreme heat, which can challenge local emergency and health services.
Future Warming Projections and Predictive Modeling Statistics

Natural events like El Niño and La Niña shape short-term temperature changes. El Niño releases extra heat from the Pacific, making conditions warmer. La Niña, on the other hand, cools things down by balancing this heat. Recently, shifts between these two weather patterns have caused noticeable swings in global temperatures. A strong El Niño can raise temperatures quickly, while a weak La Niña can slow the warming, affecting yearly temperature records and making forecasts trickier.
Experts now predict that 2025 will be cooler than 2024, and it could end up as the third warmest year on record. This expected cooling comes as a weak La Niña begins, even though some signs hint that an El Niño might return later in the year. Researchers using climate models agree on this short-term cooling. Yet, they also warn that natural shifts can hide the long-term warming effects caused by human activity and other factors. Multiple models support this view by including both natural climate swings and human influences.
Carbon budgets highlight the need for urgent global action. Studies show that if we continue emitting at current levels, there are less than 10 years to keep warming under 1.5 °C above pre-industrial levels, and fewer than 30 years to stay under a 2 °C rise. These tight timeframes demand quick cuts in greenhouse gas emissions and unified policies to shift toward a cleaner, more sustainable energy system.
Key Tools and Datasets for Climate Change Statistical Analysis
The Climate Shift Index, Ocean CSI, and Tropical Cyclone CSI are key tools that update daily. They use proven methods to track local temperature rises, changes in sea surface temperature, and storm strength caused by a warming climate. Interactive maps let communities and researchers see flood zones and coastal hazards in real time. For instance, these flood maps use clear environmental visuals to mark areas at risk, which is useful for local planning and risk management.
Other datasets help deepen research and guide policy. Picturing Our Future provides long-term sea level forecasts built on past trends and future projections. This data is crucial for coastal regions prone to flooding. U.S. solar generation data from 2023, which hit record levels, adds to our understanding of how renewable energy trends change with the climate. Local heat studies and related climate figures also offer detailed looks at city temperature patterns, supporting smart choices for sustainable growth and regional climate solutions.
Final Words
In the action, this article outlined key climate metrics. We observed global warming, rising CO₂ emissions, and detailed extremes of temperature across regions. It analyzed future conditions and the need for swift policy adjustments. Climate change statistics guide our understanding and shape our response. Data-driven tools offer clarity for the challenges ahead. Collectively, these insights support informed decisions and encourage progress towards a cooler, safer world.
The numbers help paint a realistic picture of our changing planet, while efforts to curb emissions and adopt green energy signal positive steps forward.

